We’re delighted to support the Night of the 10,000m PBs with our competition management and entry systems, and trying to push the envelope on an already amazing experience with technology innovations. For the past few years we have been happily working with Ben Pochee to take the club entries and ensure the race results are online as quickly as possible. We’ve been able to automatically upload the results as soon as they are recorded for some years. On Saturday night, we broadcast live splits directly to the phones and web browsers of over 1000 people, as well as TV titles .
Live splits
The challenge now was to get the next level of information out. After all, if you’re watching a 10,000, you want to know how the runners are doing, and who’s where in the pack, who paced it well, who blew up and so on.
Last year we were able to capture live splits and deliver a leaderboard to commentators, but weren’t quite ready to roll out to the world. This year, after a lot of preparation, we went very public with this.
Nick Anderson, commentator, says:
It’s a game changer for commentary …we were able to keep the audience fully in touch with leaders, splits and placings as the race unfolded. We were also able to track pace and target times…
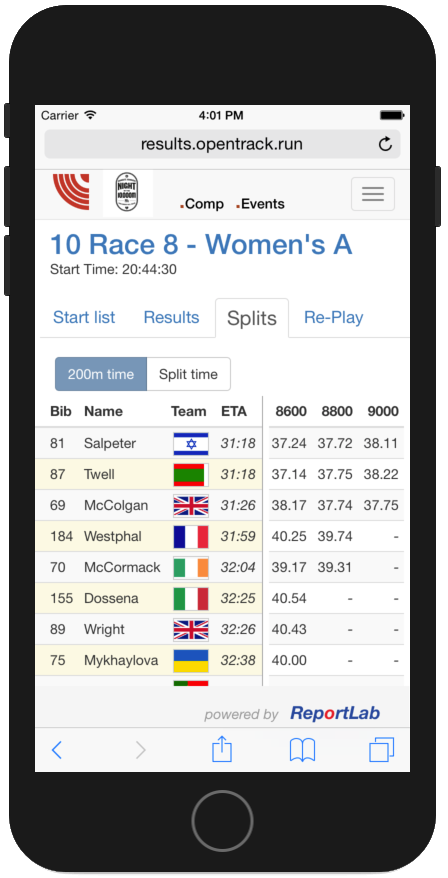
The number of connected phones and screens grew gradually from about 50 at the start of the first race, to over 1000 during the Mens’ A Race. At the same time, the number of hits per minute on our web server grew to about 3,000, and about 600,000 on the day. So, quite a lot of people were watching! Here’s what they saw…the left side of the screen stays constant, and the right scrolls gradually past you…

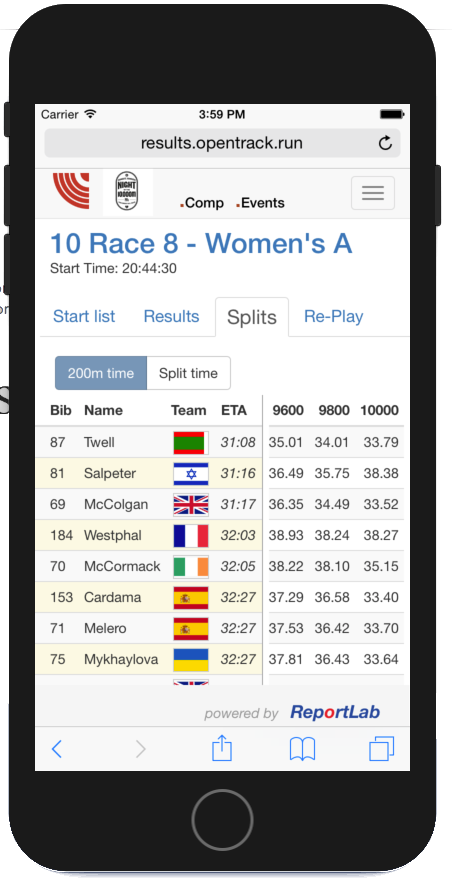
If you want to see the effect, browse to one of the races now, go to the fourth tab “Re-Play”, and hit Play. It should work on all sizes of device.
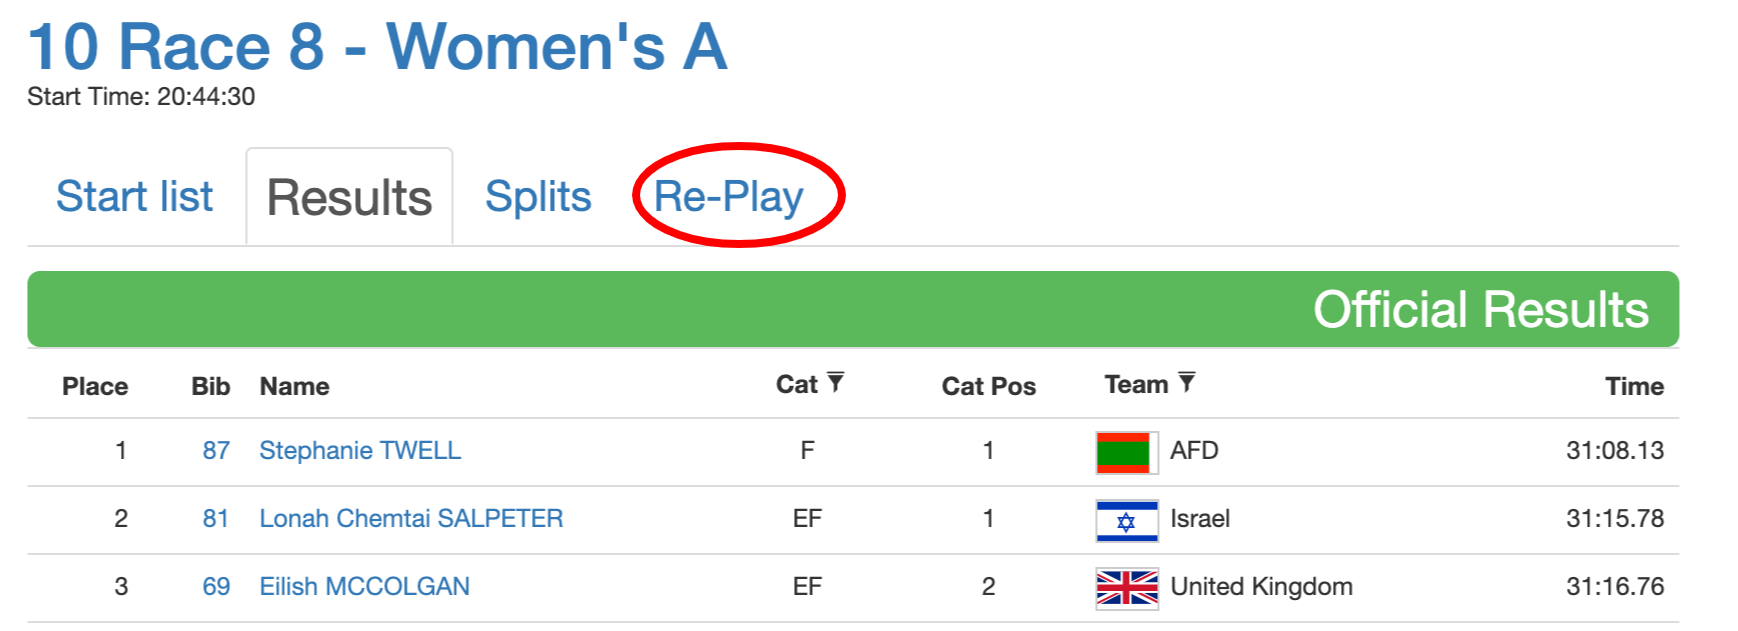
Anyone on the website would have seen times (typically accurate to 3-4 hundredths) and provisional results as they crossed the line, to be replaced with the official photofinish times shortly after.
Chip timing does produce some quirks, such as when the second place Mens’ B runner dropped a chip with a couple of laps to go and vanished from the preview, or when we overheard one of the best ever pre-race questions: “Athlete x wants to run barefoot. Where do we put the chip?” But overall, we think it really enhance the experience.
A big thanks to Phil James and Steve Marshall at Seiko Timing (UK), who worked with us to find an easy way to get their transponder times up to our web servers, as well as operating it all on the day. As soon as a race was recorded and checked, we clicked something to change the dislay from ‘provisonal’ to ‘official’ on the web site, and printed and circulated a PDF copy to the Technical Information Centre (by runner, as they didn’t have a printer down there!)
TV graphics
At the same time, our Competition Management System created TV overlays for start lists and results. Thanks to Matt Quine at Vinco, who worked with us to devise this a year ago. Below is a screenshot, which will take you to the recorded live stream on Vinco’s site if you want to watch the races…:
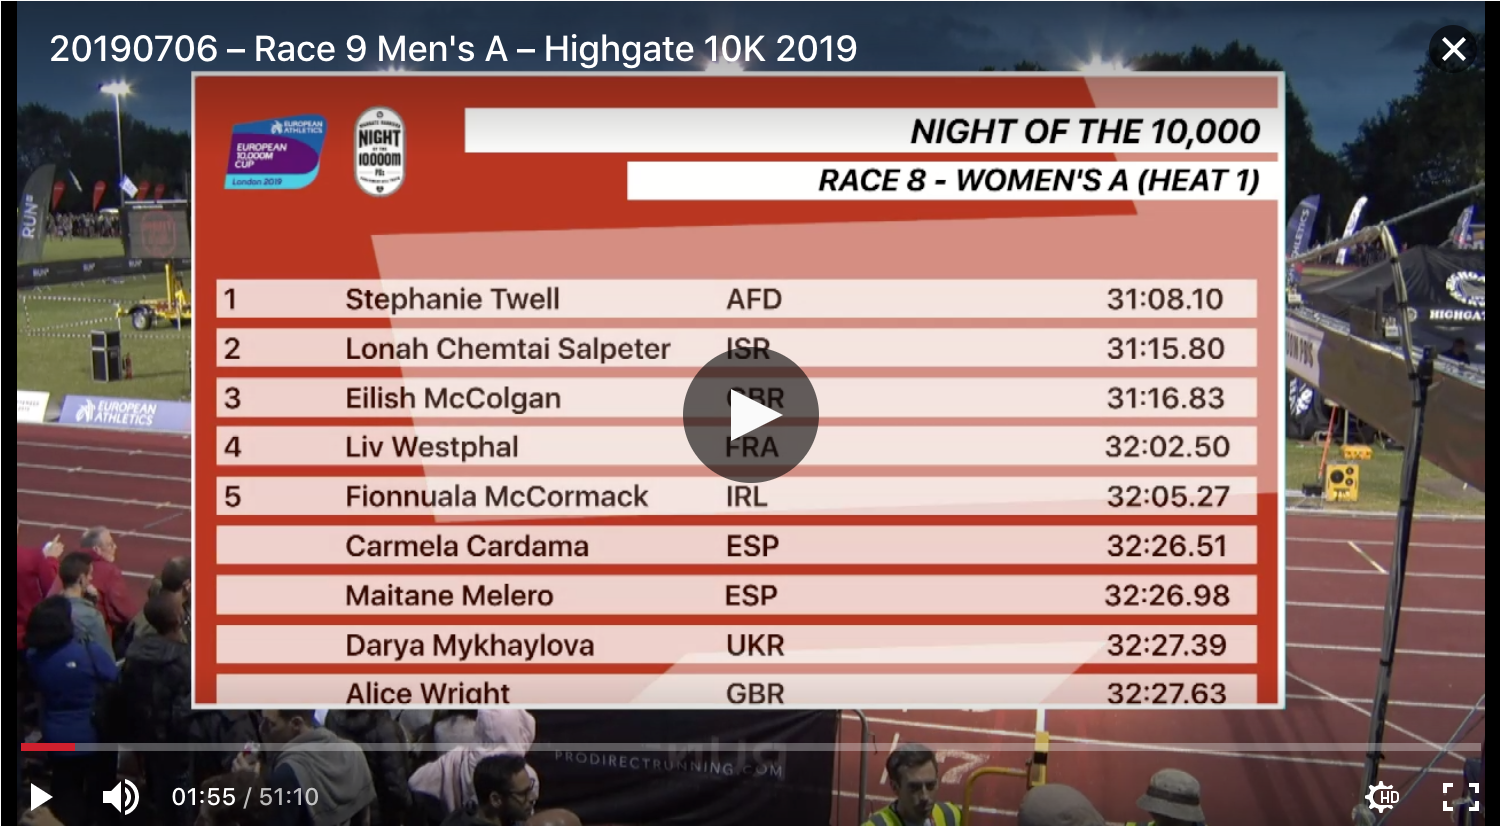
This solution is available for every competition on OpenTrack, and is being used regularly on local TV in Cyprus and Malta. We simply make a web page with a transparent or fixed-colour background, and the operator chooses what to display - timetable, start list or results. No video equipment is needed, and the backdrop can be customised.
Team Scores
Finally, we were tasked with working out the combined scores for the European Cup 10,000m. This is based on the best 3 times, across two races. As soon as the race was marked official, a web page and a PDF report were available for prizegiving - although we did take about 2 minutes to check the maths before passing it over for prizegiving! You can look at the scoresheet here…
How we did it - for geeks only!
From here on down it gets technical - if that’s not for you, feel free to tune out now!
- Seiko and UKA laid two wire loops under the track at the 200m and 400m points.
- Athletes wore active transponders on their shoes, which basically encode their bib number
- Seiko have a console showing lap times, and crucially, allowing accurate lap counting, in addition to the PhotoFinish package
- They kindly developed a file format to contain the bib, elapsed distance and elapsed time each time someone crosses a mat, and wrote this out to disk, in the same directory which hold the photofinish files.
- We already have a windows program which syncs this directory to our web server every time a file is changes.
- The web server updates the race record on our system with the new splits, every 5 seconds or so. So any new spectators loading a page at that point will see splits up until about ten seconds ago.
- We use a web service (pusher.com) which allows every open web page to listen for new data, and we send out the ‘state of the race’ every time we save. This took some clever compression to get up to 50 splits x 40 runners into a 10k message packet limit.
- The pages were created with Vue.js, and redraw smoothly every time new data is received. So, if you were watching, you would see smoothly scrolling lists of times. (We do the same for field events in a much simpler way).